

Executive summary
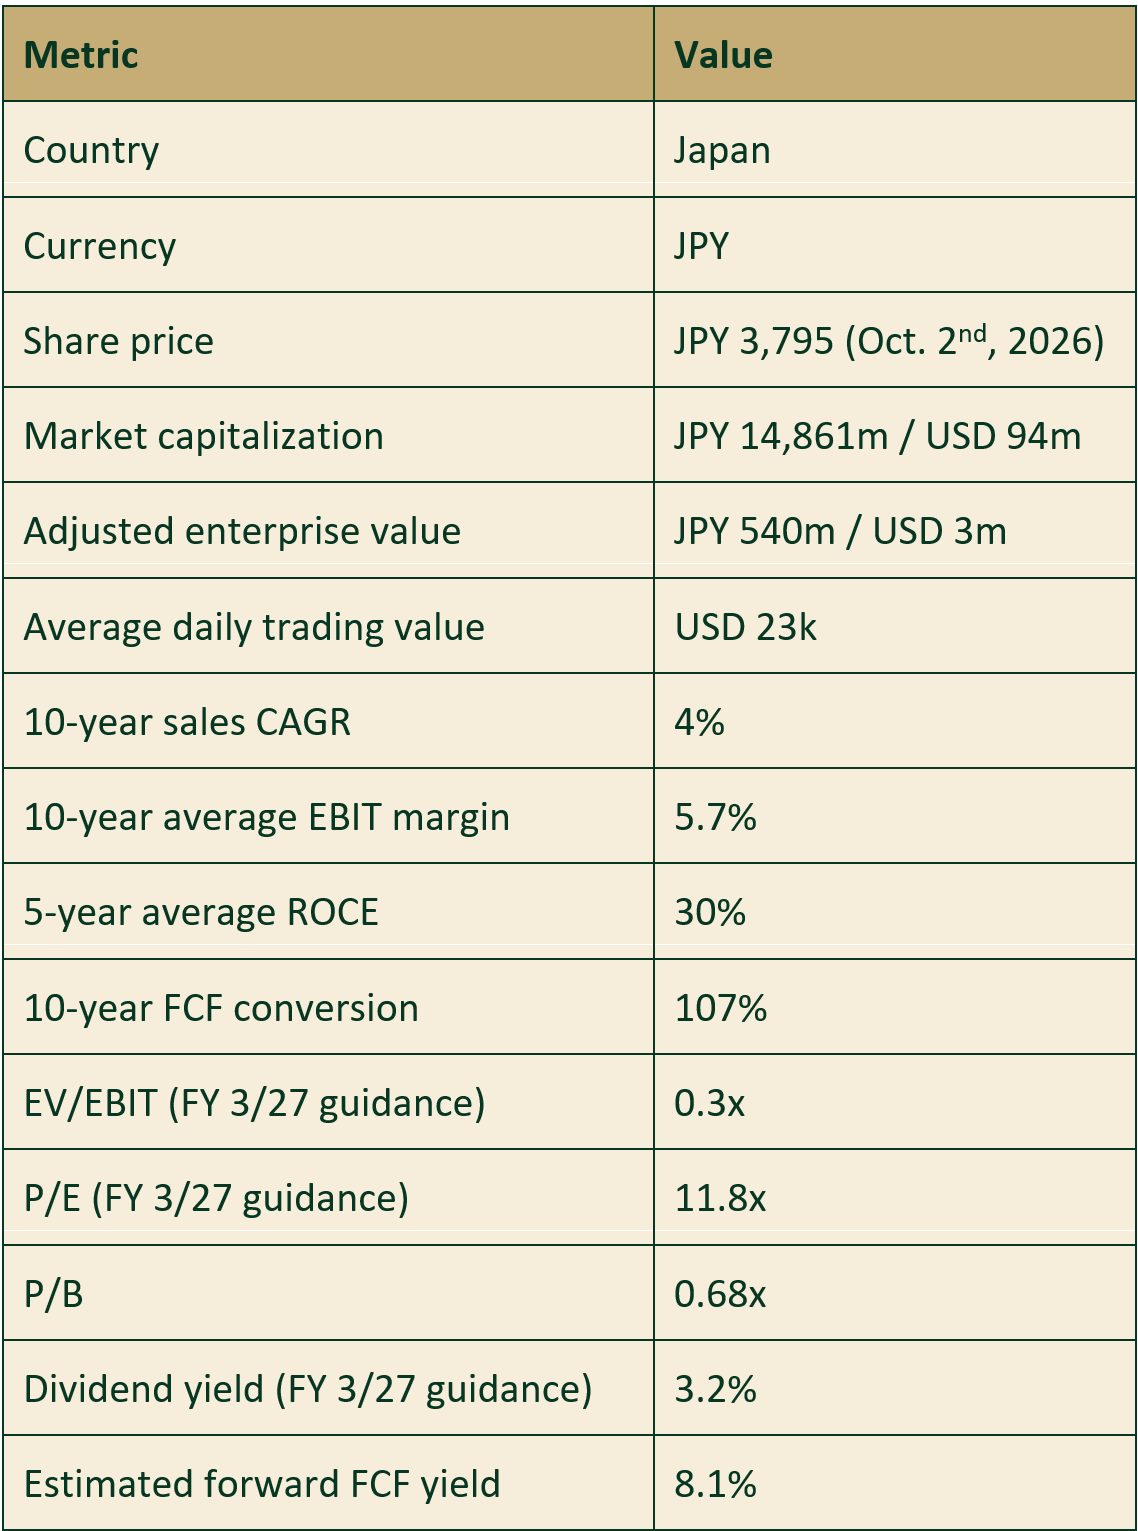
TOBA is a traditional Japanese trading company that distributes factory automation and industrial equipment without holding in-house inventory (products are shipped directly from manufacturers or importers to the end customer). This makes for a capital light business with strong returns on operating capital (5-year average ROCE of 30%) and solid free cash flow conversion (FCF 107% of net income over the last 10 years).
The company’s own medium-term plan calls for an acceleration in annual organic sales growth from 4% over the last ten years to 9% over the next three years. We do not take this for granted but like the ambition.
Net cash and financial investments make up 124% of market cap, and even after discounting net cash by our standard 30% we own the business at 0.3x EV/EBIT and a P/E of 12x.
Our base case assumption is that the company achieves its internal goal of reaching a 1.0x P/B ratio (up from the current 0.68x) in the next three years through a combination of increased dividends, share buybacks (which the company has a long history of) and continued EBIT growth. That would result in a base case return of 21% per year including dividends.
Key risks include a Japanese industrial recession (customer demand is linked to CapEx cycles, albeit broad-based) and a slower capital allocation improvement process that delays the revaluation to 1.0x P/B.
We are shareholders in the company.
Snapshot
Business and competitive position
TOBA supplies control, factory-automation and industrial equipment, mainly directly to manufacturers. Its value added is selecting suitable products, advising on applications and delivering reliably. About 1,200 suppliers and 23 Japanese sales offices give it breadth and local access. Technical staff help customers combine components and equipment into workable production systems.
Factory automation accounted for 46% of FY2026 sales, control equipment 28% and industrial equipment 26%. The range runs from pneumatics and sensors to robots, assembly equipment, conveyors and filtration.
Supplier relationships and application knowledge can encourage repeat orders. SMC lists TOBA as an Elite Partner, alongside other agencies. That supports its commercial standing but offers little evidence of exclusive access or strong pricing power. Broader distributors such as Yamazen, YUASA and Nichiden compete with specialists and manufacturers selling directly.
Japan represented 89% of FY2026 sales and China 11%. No individual customer exceeded 10%. Demand can still be concentrated in industrial investment cycles. Component replacement produces repeat business, while larger installations depend on customers approving projects.
Long term financial development

20-year sales CAGR is 1%, compared with 4% over the last ten years. This is a semi-cyclical business with slow and steady underlying growth linked to nominal GDP in Japan.
20-year average EBIT margins were 5.5% and – except for FY 2010 (calendar 2009) which was break-even – margins have been very stable in the 4-7% range.
The company’s own medium-term plan (dated May 2026) calls for a 2026-2029 sales CAGR of 9%, an EBIT CAGR of 15% and a net income CAGR of 14%. This would be a step-up in organic sales growth and is not something we count on (although we like the ambition).

Capital employed has been flat over the last 15 years. The five-year average pre-tax ROCE of 30% is attractive and reflects the benefit of supplier financing (80-90 days payables) and the limited fixed assets a distributor requires (15-year average CapEx/EBITDA is only 5%). Despite the strong operating ROCE, FY2026 ROE was only 5% due to the overcapitalized balance sheet.
Cash generation and quality

Consistent with the trading company business model and the solid ROCE, conversion of net income to free cash flow has been strong. The latest five-year cumulative FCF was 114% of cumulative adjusted net income.
Capital allocation and governance
The company held JPY 13,534m of cash and deposits in June 2026. In March it also held JPY 2,100m of long-term deposits and JPY 2,887m of investment securities. Together they make up 124% of market cap. This explains why strong returns on operating capital coexist with modest returns on equity.
Dividends and buybacks totaled JPY 4,940m over FY2020–26, or 63% of FCF and 33% of the current market cap. FY2026’s JPY 150 dividend included a JPY 20 anniversary payment. FY2027 guidance is JPY 120 (3.2% yield). The company has a long history of share buybacks and over the last 20 years the share count has declined from 5.3m to 3.9m (1.5% per year on average). The most recent repurchase in August 2026 cost JPY 174m and reduced the outstanding share count by 1.1%.
The founding Toba family still owns 12-13% of the company (directly and via trust), a business partner shareholder association owns 7%. Supplier SMC 2% and broad-based small-cap investor Hikari Tsushin own 2% each. Three outside directors are designated independent, but the shareholder structure makes TOBA a somewhat unlikely activist candidate.
Valuation and the use of financial assets

As a rule, we only credit 70% of net cash assets to enterprise value for our companies. Overcapitalized small- and micro-cap companies tend to view cash as a long-term security-blanket and crediting 100% of net cash to EV would understate valuation multiples.
At JPY 3,795 per share, market capitalization is JPY 14,861m and the adjusted EV just JPY 540m. At 0.3x EV/EBIT (despite only crediting 70% of net cash) we are essentially getting the operating business “for free”, but the overcapitalized balance sheet with low-yielding cash assets still results in a 12x P/E.
Our estimate of forward free cash flow is approximately JPY 1,200m (compared to a 5-year historical average of JPY 1,386m), which is 8% of the current market capitalization and >100% of the current EV.
Base Case Return Potential
Assume 3% annual growth in net income and book value
Assume a 1.0x P/B multiple in three years (up from 0.68x today)
Implies a future market cap of JPY 24.4b
Implies a future 4x EV/EBIT multiple (crediting 70% of net cash)
14.9b to 24.4b market cap over three years is an 18% CAGR
Add 3% current dividend yield for a base case annualized return of 21%
Key Risks
A decline in customers’ capital spending (i.e. a Japanese industrial recession)
Capital allocation could remain conservative for years, limiting our equity return to a 3% dividend yield plus net income growth
Sources
Historical financial series: Koyfin and author calculations based on official Edinet filings.
Disclaimer
This publication is for information and discussion only. It is not investment advice or a recommendation to buy, hold or sell any security and does not consider your financial circumstances. Do your own due diligence and seek independent professional advice where appropriate.
I may own securities discussed and may buy, add to, reduce or sell positions at any time without notifying readers, subject to applicable disclosure requirements. My interests may differ from yours. Opinions and estimates may change without notice; I do not undertake to provide trading updates.
Information is believed reliable but may contain errors or omissions. Forecasts are uncertain, past performance does not predict future returns, and investments can lose some or all of their value. Small and micro-cap shares may be illiquid, and currency movements can affect returns.